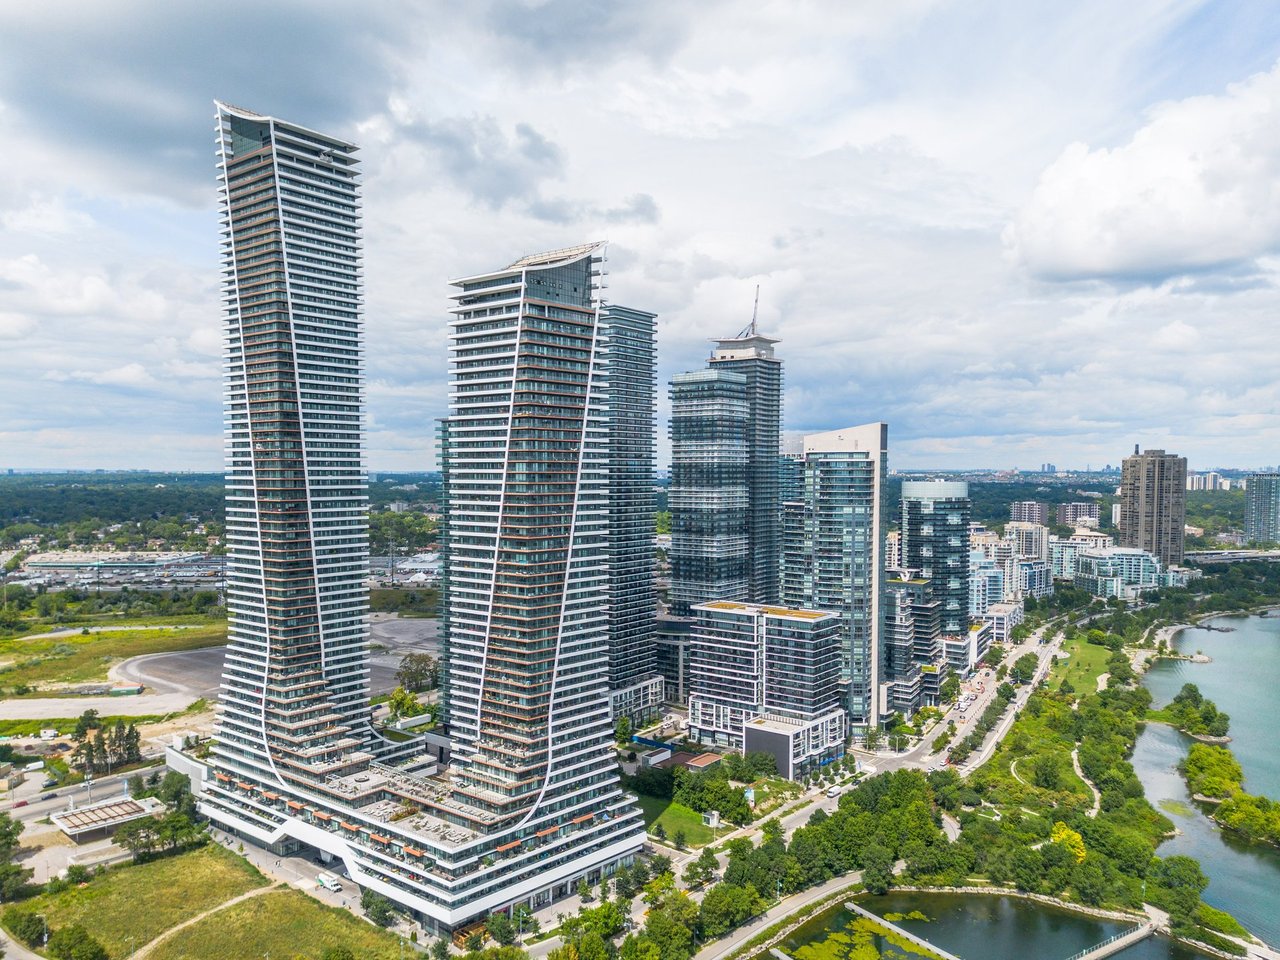
477,941 people live in Niagara Region, where the median age is 46 and the average individual income is $97,200. Data provided by Statistics Canada.
Total Population
Median Age
Population Density Population Density This is the number of people per square mile in a neighborhood.
Average individual Income
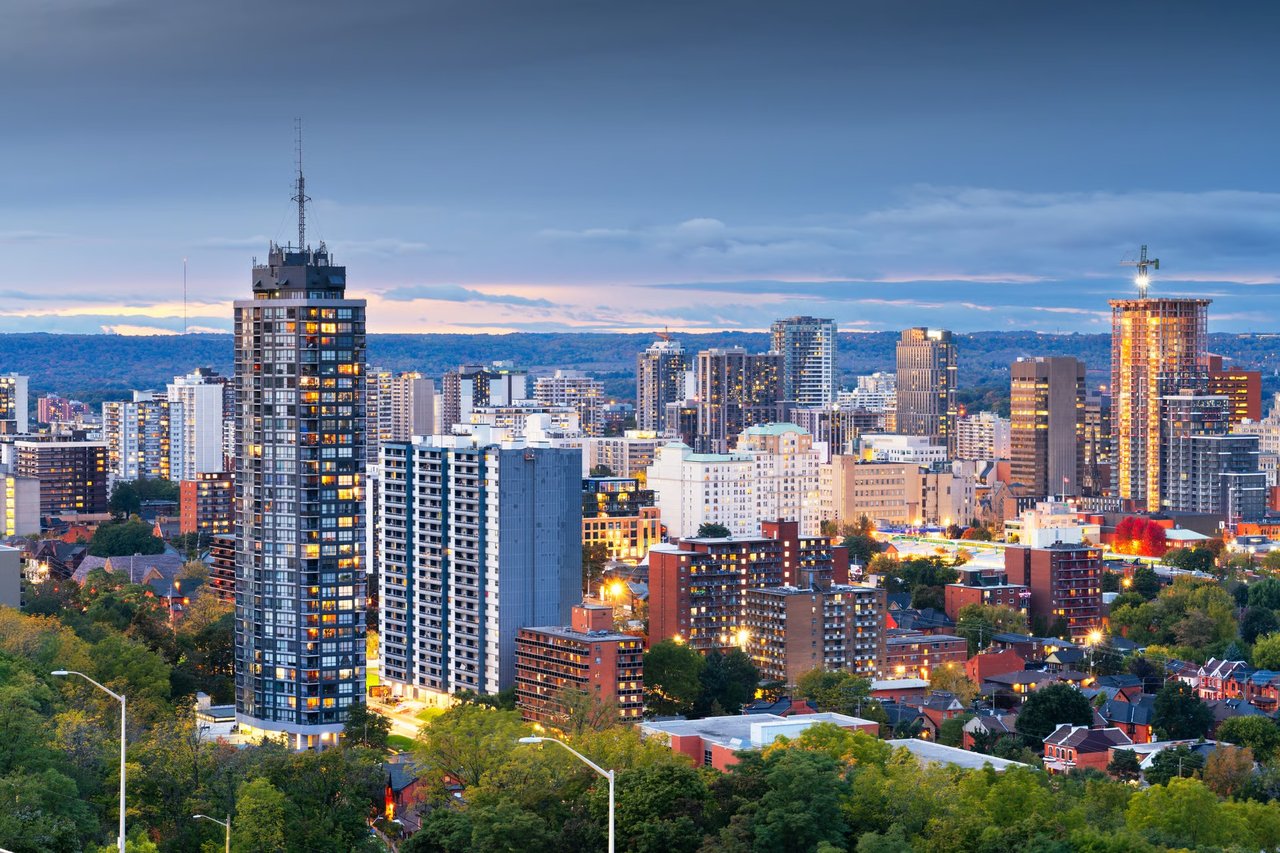
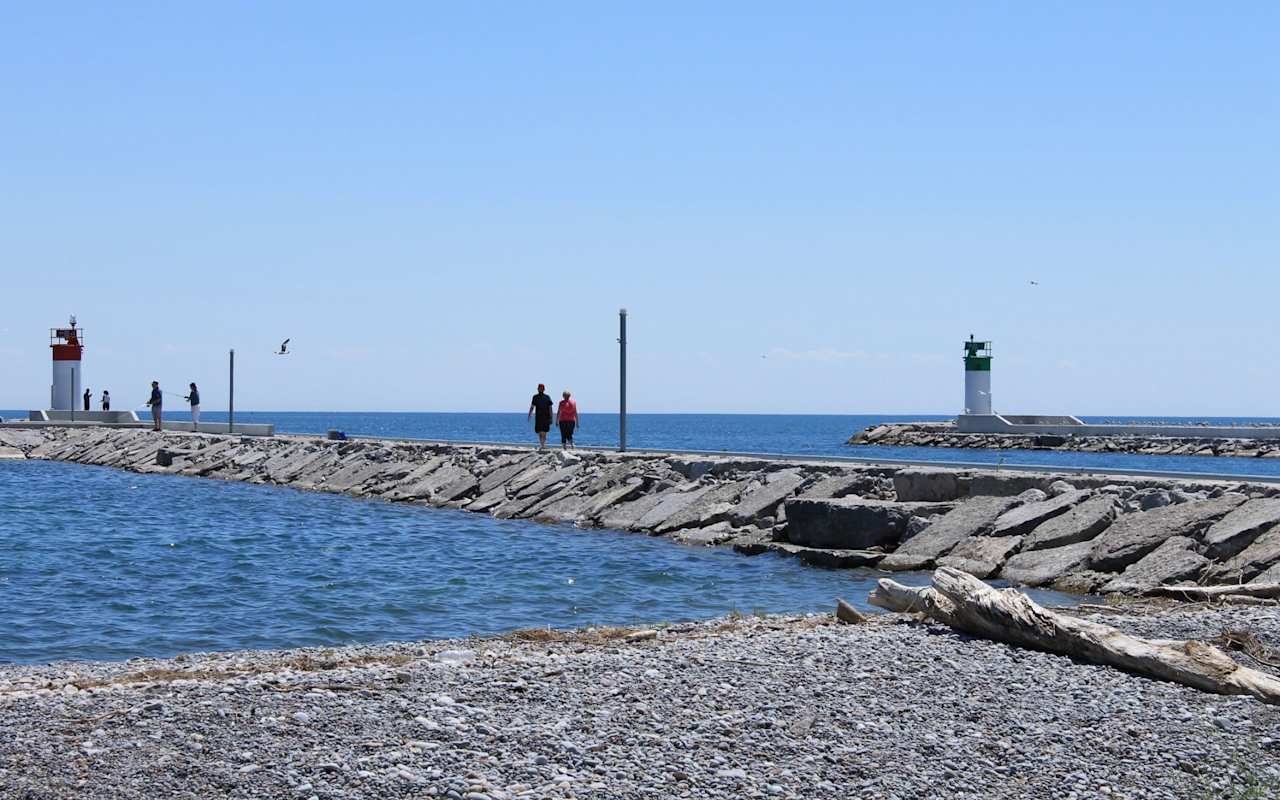
There's plenty to do around Niagara Region, including shopping, dining, nightlife, parks, and more. Data provided by Walk Score and Yelp.
Explore popular things to do in the area, including Pupo's Super Market, Cafe Amalia, and White Meadows Farms.
| Name | Category | Distance | Reviews |
Ratings by
Yelp
|
|---|---|---|---|---|
| Dining · $$ | 4.96 miles | 5 reviews | 5/5 stars | |
| Dining · $$ | 3.59 miles | 6 reviews | 4.8/5 stars | |
| Dining · $ | 2.99 miles | 31 reviews | 4.8/5 stars | |
| Dining | 2.08 miles | 5 reviews | 4.6/5 stars | |
| Dining · $$ | 4.94 miles | 23 reviews | 4.5/5 stars | |
| Dining | 3.83 miles | 9 reviews | 4.3/5 stars | |
|
|
||||
|
|
||||
|
|
||||
|
|
||||
|
|
||||
|
|
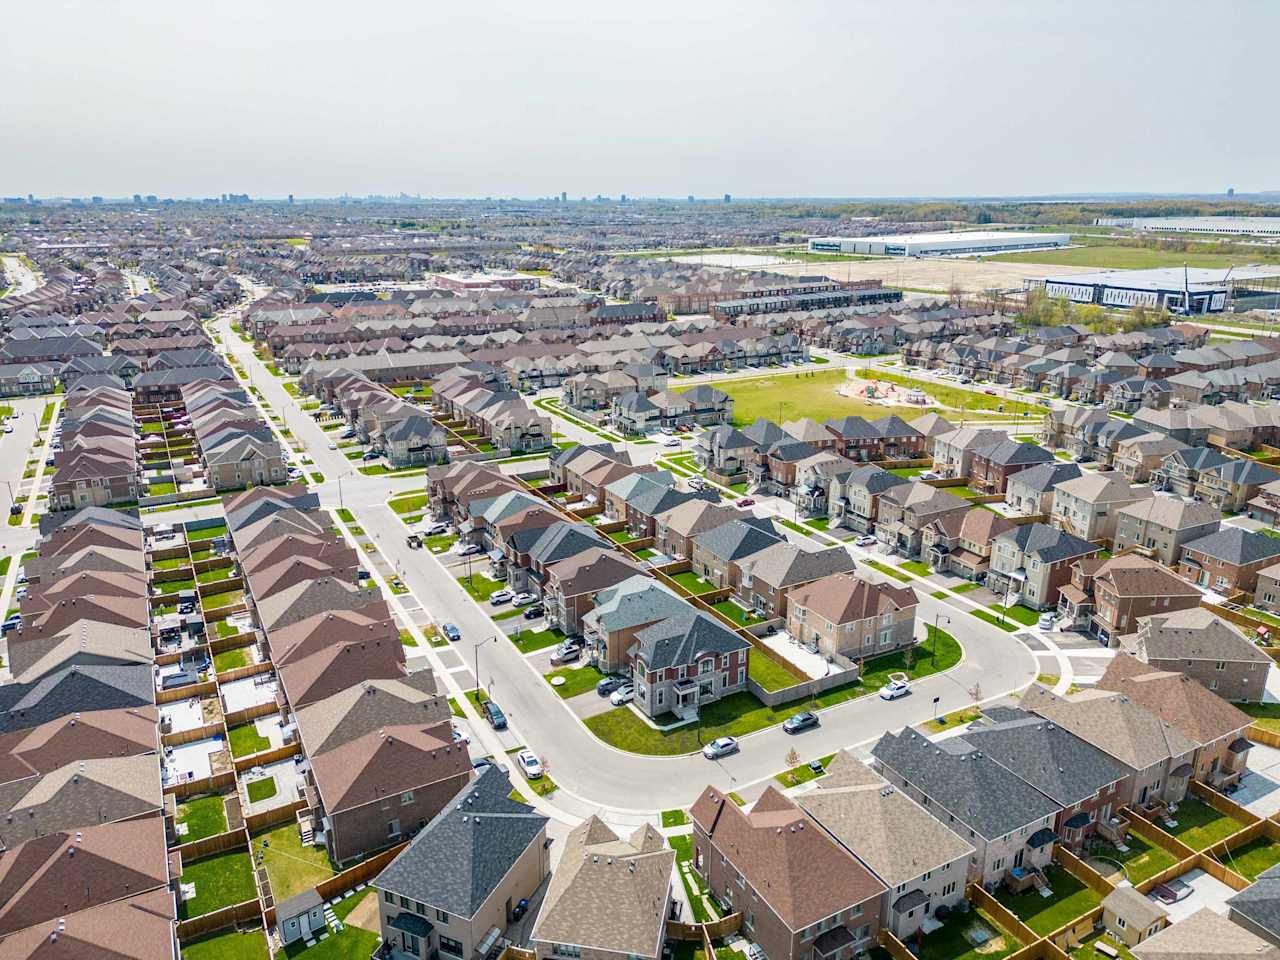
Niagara Region has 195,915 households, with an average household size of 2.4. Data provided by Statistics Canada. Here’s what the people living in Niagara Region do for work — and how long it takes them to get there. Data provided by Statistics Canada.
Total Population
Population Density Population Density This is the number of people per square mile in a neighborhood.
Median Age
Men vs Women
Population by Age Group
0-9 Years
10-17 Years
18-24 Years
25-64 Years
65-74 Years
75+ Years
Education Level
Total Households
Average Household Size
Average individual Income
Households with Children
With Children:
Without Children:
Marital Status
Blue vs White Collar Workers
Blue Collar:
White Collar:

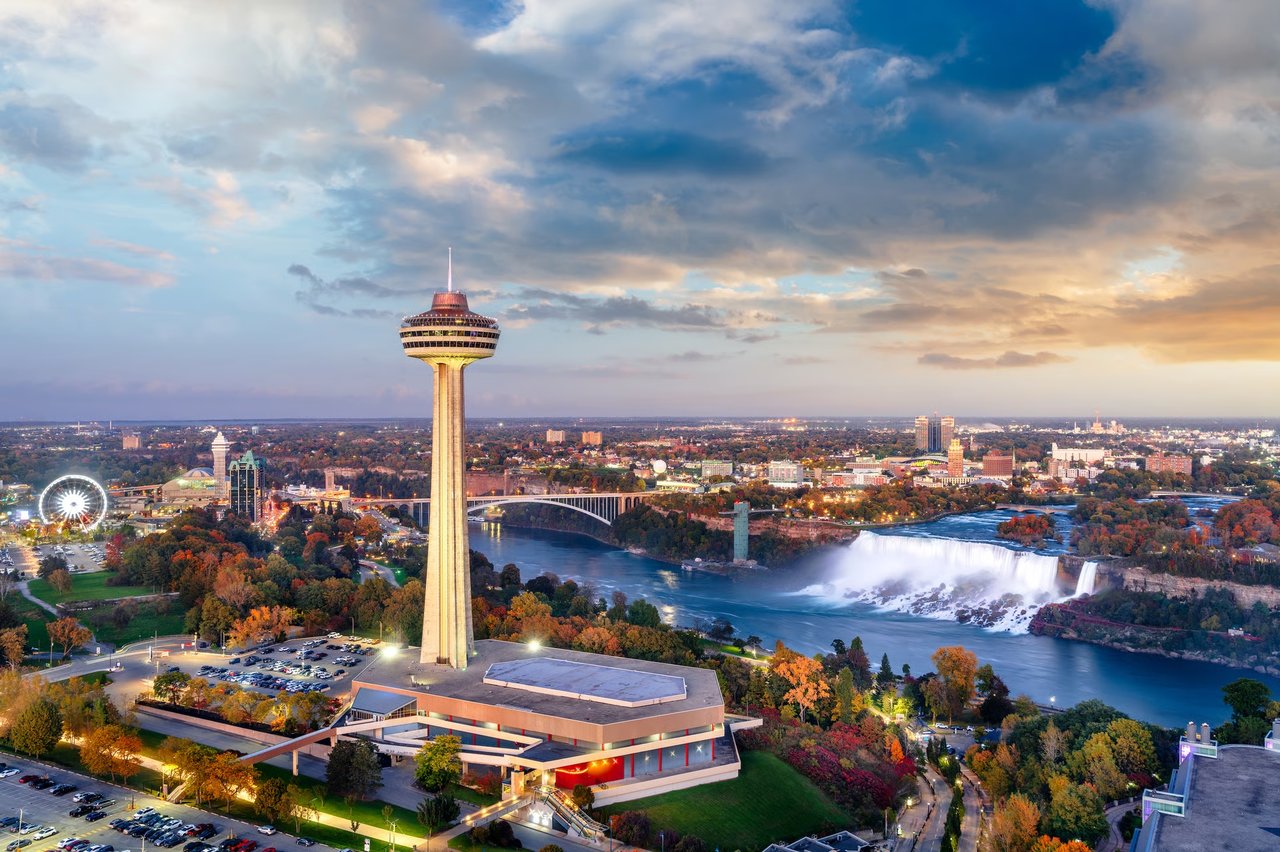
Discover listings and statistics in Southern Ontario's most sought-after locations.