There are no properties that match your search results.
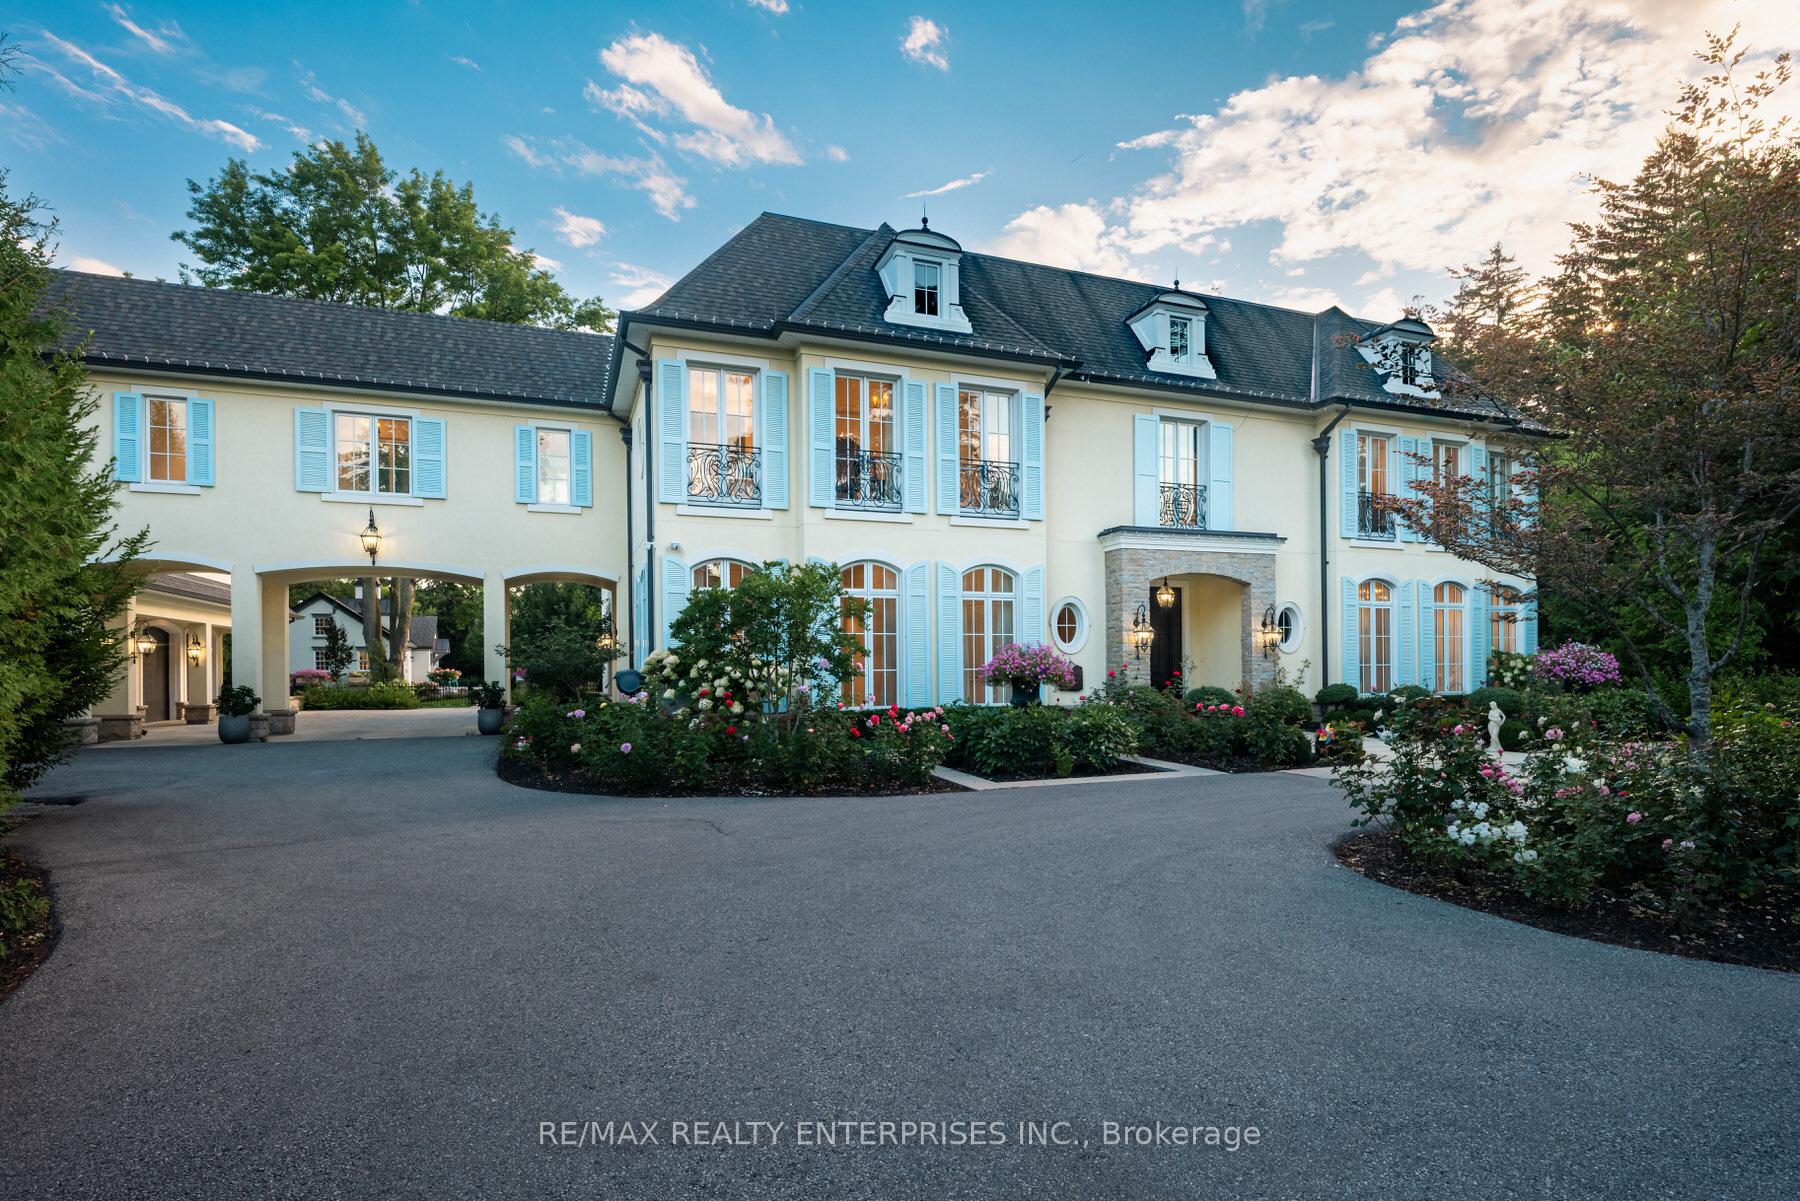
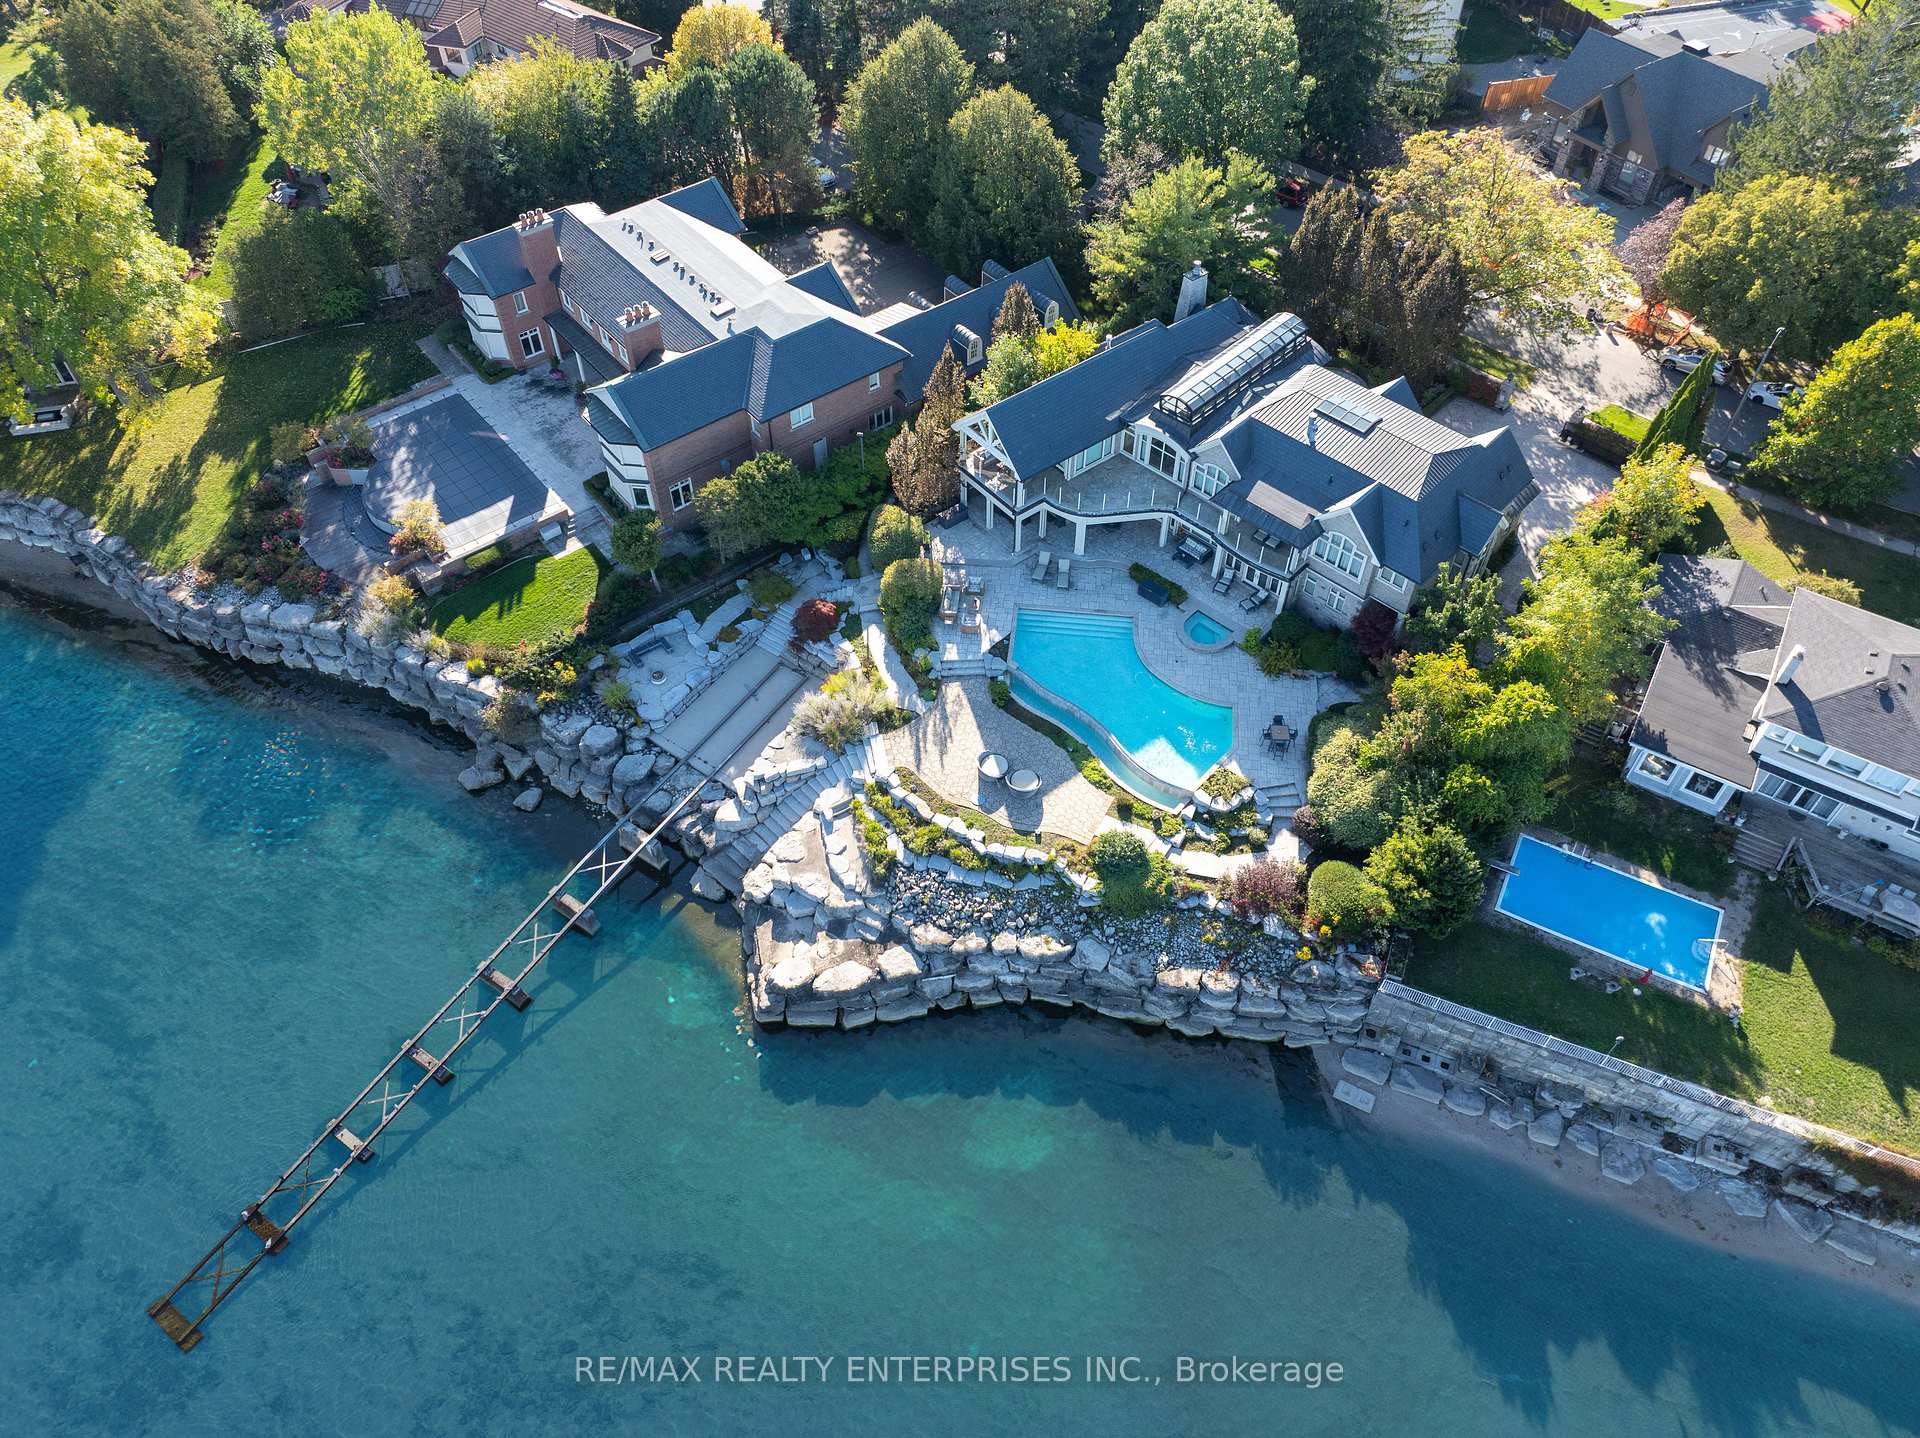
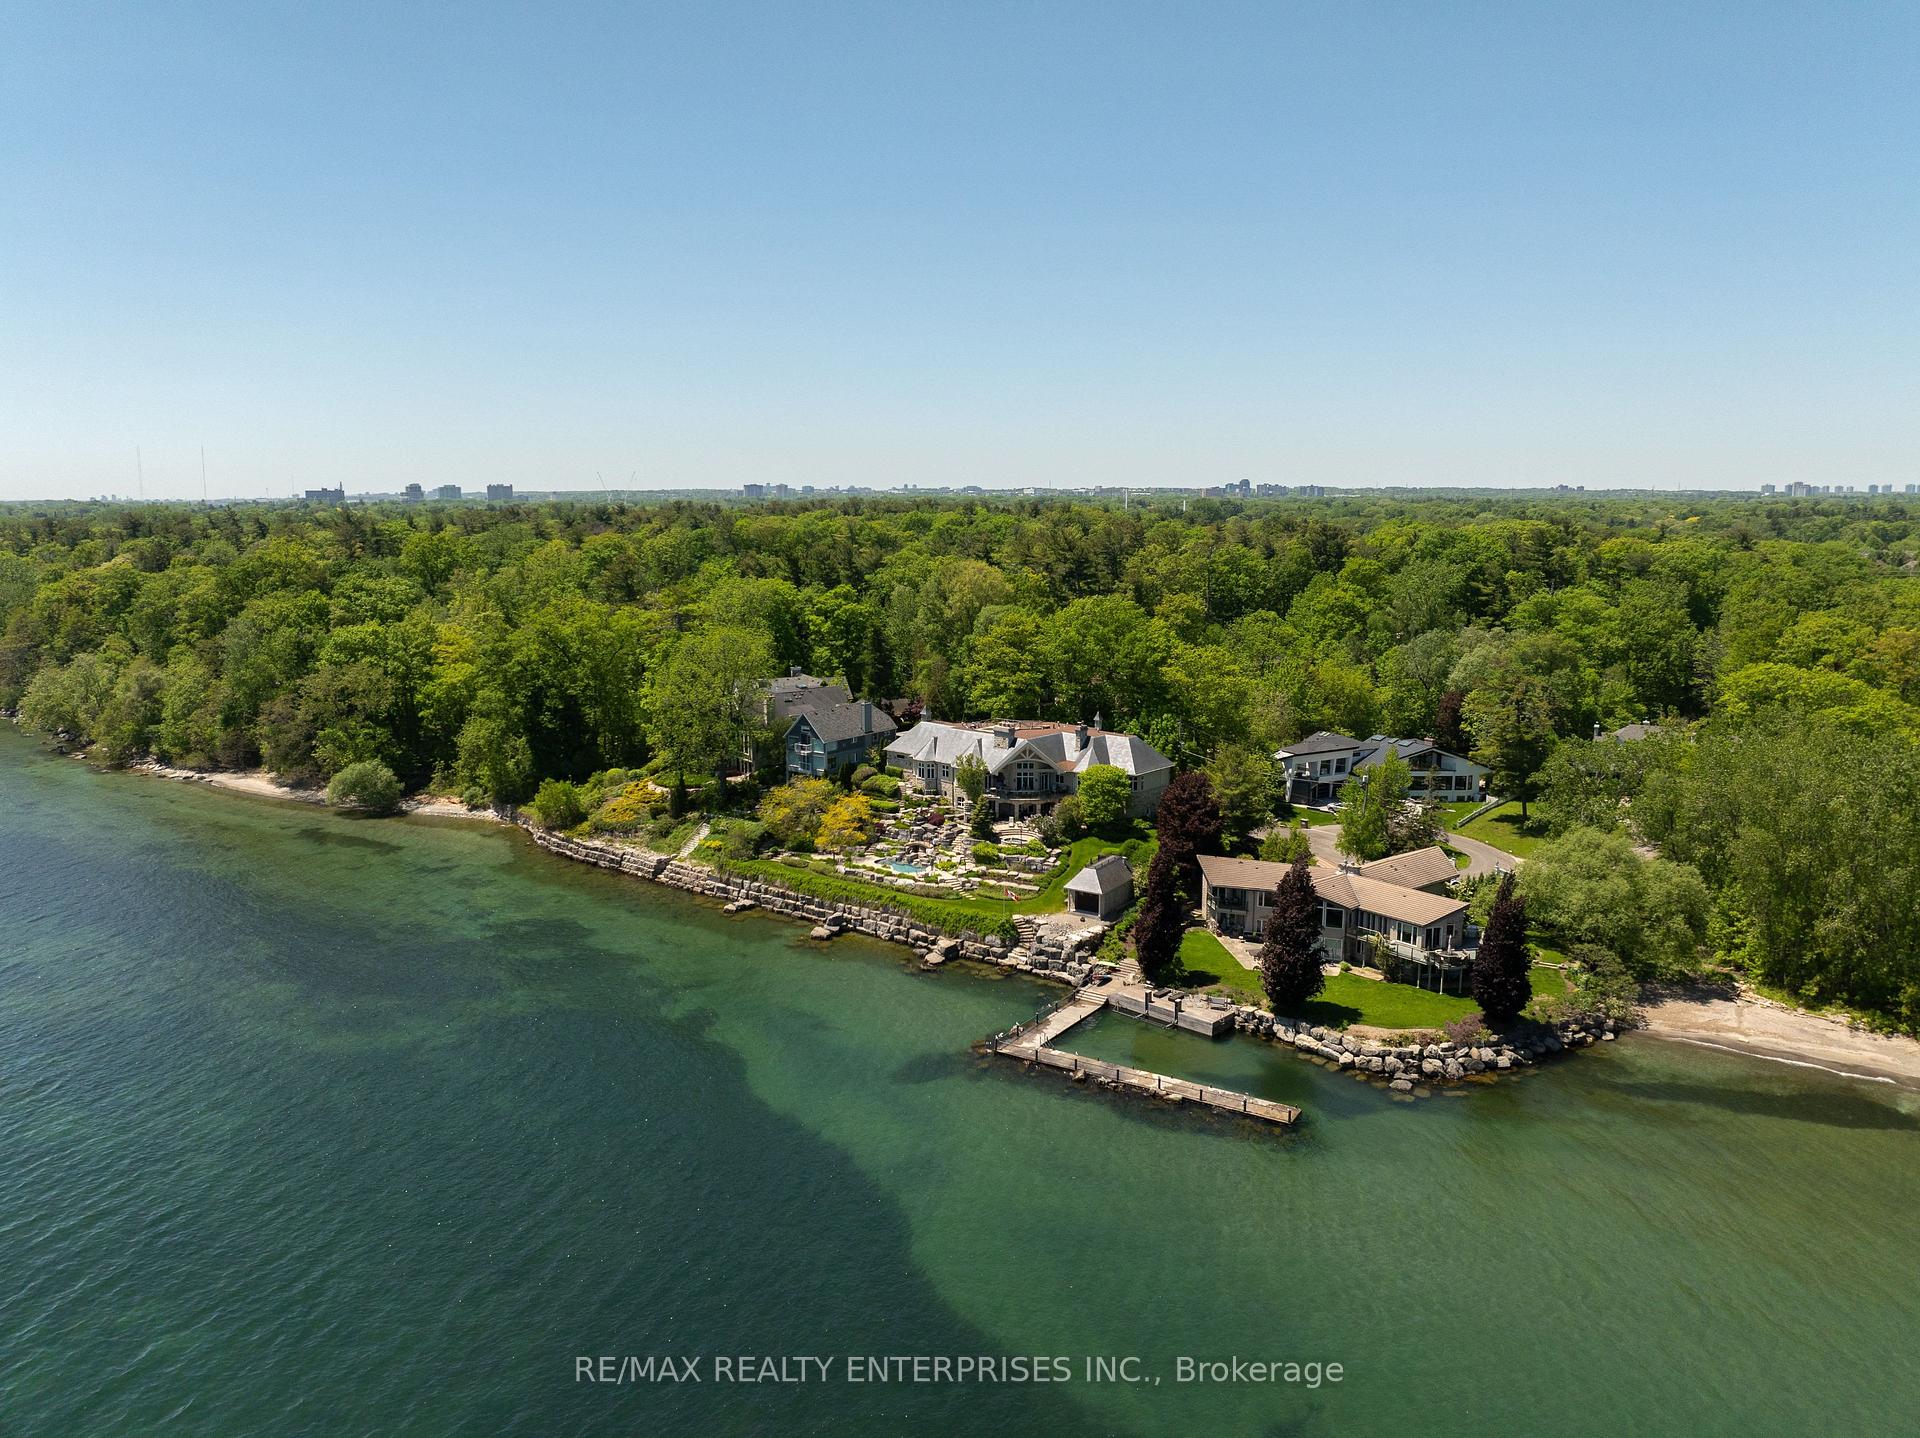
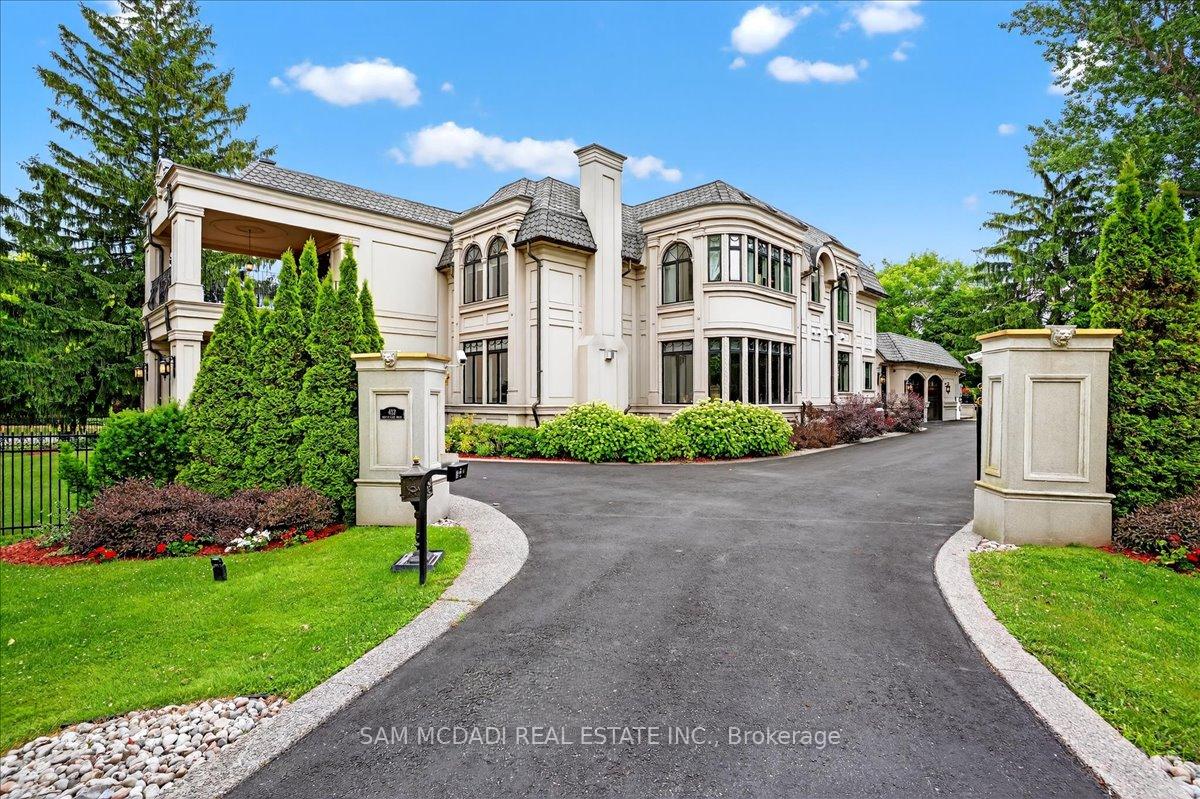
Discover listings and statistics in Southern Ontario's most sought-after locations.
How to price your home, Real estate pricing strategy, Selling a home GTA, market value, TRREB June 2026 stats, multiple offers,...
Home improvements ROI, Increase home value GTA, Best renovations for resale, minor kitchen remodel, bathroom modernization, sma...
Subscribe to our weekly e-newsletter for our latest real estate opportunities, news and other exciting updates. Stay tuned!
You have successfully been added to our Newsletter. Stay tuned for the latest updates sent straight to your inbox!
Phone
Email
Address
5805 Whittle Road Mississauga, ON L4Z 2J1
Message sent successfully!