The Greater Toronto Area’s real estate landscape continued its intricate dance with economic factors throughout October 2023. Affordability concerns and economic uncertainties, coupled with the ever-watchful eyes on Bank of Canada decisions, influenced home sales, presenting a nuanced scenario for potential buyers and sellers.
Market Performance Snapshot
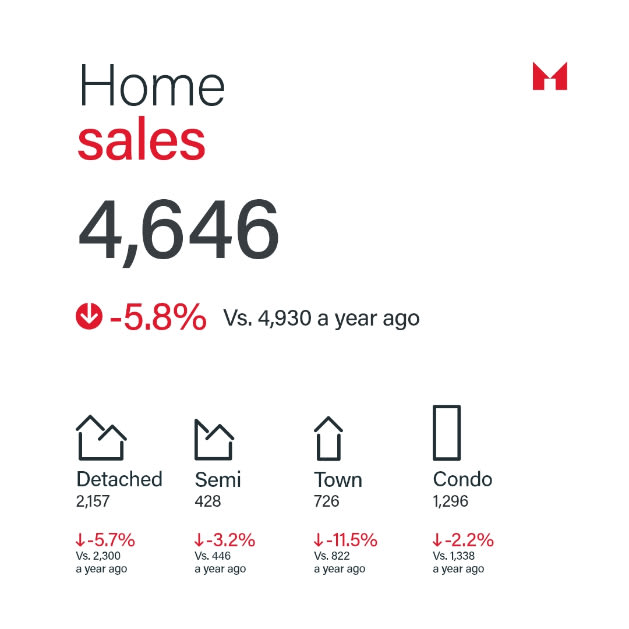
In October 2023, REALTORS® reported 4,646 home sales through TRREB’s MLS® System in the GTA, marking a 5.8% decline compared to the same month in 2022. This dip in sales was more pronounced in ground-oriented housing segments, including semi-detached houses and townhouses. On a month-over-month seasonally-adjusted basis, sales also showed a slight decrease.
Balancing Supply and Demand
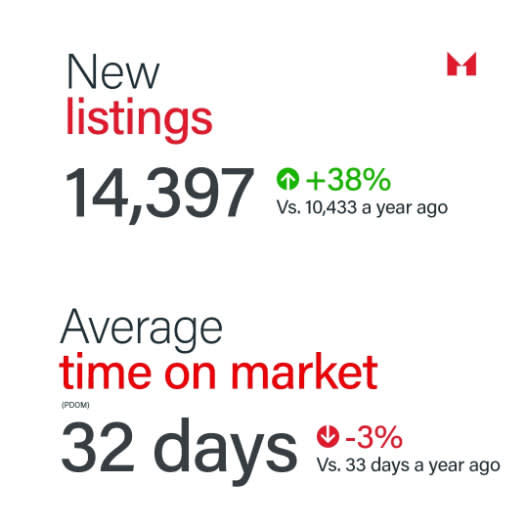
The GTA real estate market witnessed a noticeable uptick in new listings in October, a positive trend compared to the 12-year low reported in October 2022. Although new listings, on a seasonally-adjusted basis, edged slightly lower month-over-month compared to September 2023, the increased availability of properties is indicative of a more balanced market dynamic.
Price Trends
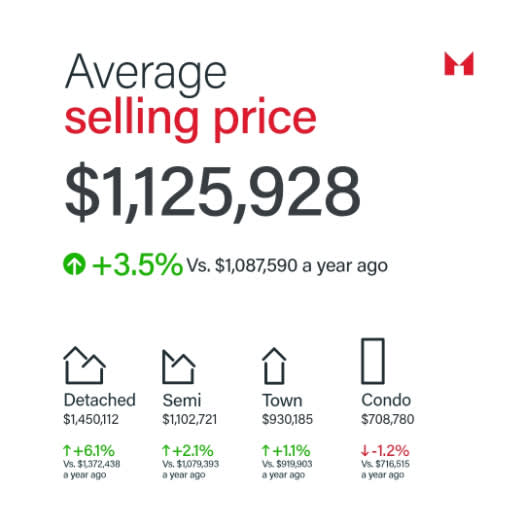
The MLS® Home Price Index (HPI) Composite benchmark displayed a 1.4% year-over-year increase in October 2023, underlining the market’s resilience. The average selling price also saw a modest year-over-year uptick of 3.5%. However, on a seasonally-adjusted basis, both the average selling price and the MLS® HPI Composite benchmark registered marginal decreases.
Property Type Insights
Breaking down the data by property types, detached homes in the GTA experienced a notable 6.1% year-over-year price increase, reaching an average selling price of $1,450,112. Semi-detached homes followed suit with a 2.1% year-over-year price growth, standing at $1,102,721. Townhomes also saw a price increase of 1.1%, reaching an average selling price of $930,185. In contrast, condo units experienced a slight year-over-year decline of -1.2%.
Sales Trends by Property Type
The decline in home sales in October 2023 was particularly notable in the semi-detached segment, where sales fell by -3.2% compared to October 2022. Detached homes and townhouses also saw declines in sales volume, with drops of -5.7% and -11.5%, respectively. In contrast, sales of condo units remained relatively stable, with only a slight -2.2% decrease.
New Listings Surge
One of the month’s positive developments was the substantial year-over-year increase in new listings, growing by a notable 38%. This surge contributes to a more balanced market dynamic by increasing the availability of properties.
Slightly Faster Sales Times
Properties in the GTA sold at a slightly faster pace in September 2023 and maintained this trend in October, with an average listing period of 32 days, compared to 33 days a year ago. This reduction in the Property Days on Market (PDOM) equates to an estimated -3% reduction in the time it takes to sell a home.
Transition from Late Summer to Early Fall: Trends Unveiled
As we transitioned from late summer to early fall, certain trends shaped the GTA real estate landscape:
- Sales Volume Decline: Notably, there’s a 5.8% reduction in home sales from September to October. This trend aligns with seasonal expectations and could also be influenced by increasing economic uncertainties.
- Price Resilience: Despite the dip in sales, the average selling price and the MLS® HPI Composite benchmark held their ground, showing a 3.5% and 1.4% year-over-year increase, respectively. This resilience in property prices indicates a stable market even amidst changing seasons and economic dynamics.
- New Listings Uptick: Interestingly, there was a significant uptick in new listings from September to October, growing by a substantial 38%. This surge in new listings could be an encouraging sign for potential buyers, pointing towards a more balanced market dynamic and increased property availability.
- Changing Property Type Dynamics: Across property types, detached homes experienced a notable 6.1% year-over-year price increase, while semi-detached homes saw a 2.1% increase. However, there were declines in sales volumes for semi-detached homes, townhouses, and detached homes. In contrast, condo units showed relative stability in both prices and sales.
What’s Next?
While affordability concerns and uncertainty still linger, the GTA real estate market remains resilient. Team McDadi, with over 35 years of industry experience, stands as the #1 real estate team in the GTA, committed to helping you navigate these market dynamics with confidence.
For a comprehensive look at all our current listings,
visit here.
In a market that’s always changing, Team McDadi remains dedicated to helping you achieve your real estate goals. With unmatched knowledge and dedication to excellence, we’re your trusted partner in the ever-dynamic GTA real estate landscape.